downtown-san-diego-real-estate/2008-sale-activity-by-month/339/
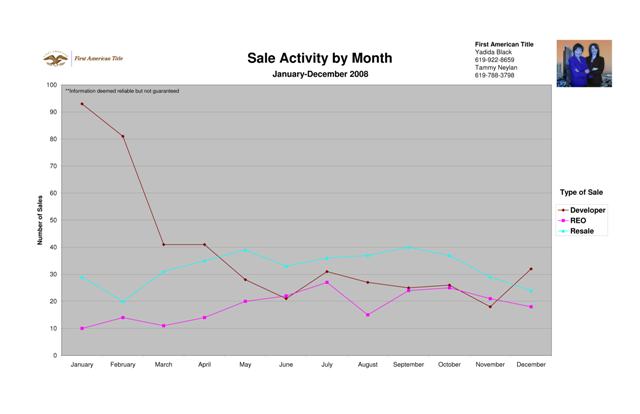
The above graph delves even deeper into 2008 Downtown Condo and Loft sales by disecting the type of sales by month.
January of ‘08 saw the biggest number of Developer sales at just above 90. February decreased to just above 80, and the biggest drop all year was between February and March declining all the way to just above 40. While Developer sales led the pack to begin with, we saw a drop of sales below REO’s and Resales twice in ‘08. They did, however, end the year in the lead but well within reach of REO’s and Resales.
As stated in a previous 92101 blog 2008 Types of Downtown Sales, 2008 was the last year that well see any new residential development in the 92101 area code until at least 2012. This could be a major contributor as to why Developer sales were at their highest when these projects were in their initial sales stages.
Resales began the year at just above 30 sales and saw an average incline throughout the remainder of the year, with a minor decline in June. Beginning in September, Resales began to slowly decline through December.
REO’s, on average, saw an increase. Declines occurred in March and August and through the months of October and December.
')}