downtown-san-diego-real-estate/2008-breakdown-of-92101-neighborhoods-by-sale-type/325/
 Many, many thanks to our friends over at First American Title, Tammy Neylan and Yadida Black, for putting together some very viable graphs charting sales in the 92101 area code. Above you will find a breakdown of 6 neighborhoods by type of sale: Resale, REO, Developer and Foreclosure. This chart follows up on our ongoing commitment to bring the latest statistics affecting sales and purchasing in Downtown San Diego.
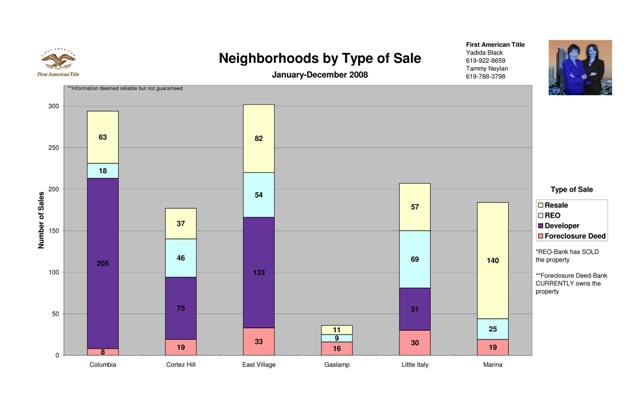
Just a recap: the Marina District leads the way with 140 resales in 2008 which makes up 36% of all resales in the Downtown market. Next in line is the East Village with 82 resales at a percentage of 21%. These rates are pretty congruent with the types of buyers and sellers we’ve represented even in the last few months alone.
Leading the way with REO, Real Estate Owned or “Bank Owned”, properties is the Little Itlay neighborhood with 69, or 31% of the entire REO market in 2008. Not far behind is the East Village with 54, or 24%.
As construction would suggest the Columbia District led the way with Developer sales at a rate of 44%, or 205 total. This due to the developments like Sapphire and Bayside. There were no Developer sales in The Gaslamp or Marina neighborhoods because these areas are already fully developed.
Finally, we see the most sales due to foreclosure in the East Village neighborhood with 33 total at 26%. Closely behind is Little Italy wth 30 or 24%.
It’s our hope that this graph, along with the others we will be posting in the following weeks, will assist our buyers and our sellers in making the most well educated decisions regarding the purchase or sale of a new Downtown Condo or Loft.
')}
//